The Desk is an optional workspace surface, off by default. An admin turns it on under Settings → General → Workspace surfaces. Until then, the page shows what it does rather than disappearing from the nav.Turning it on also changes intake: from that point, inbound leads from calls, texts, and forms are captured as deals.
Contacts and companies
Contacts is the directory: every person and company in one list, with tabs for Lead sources (what is arriving and from where) and Source performance. Filter to people or companies, sort by last activity, and open any row without losing your place — records open as a sheet over the list, so working through fifty rows does not mean fifty page loads. A contact carries the details you would expect (title, email, phone, LinkedIn, notes), the deals they are on, and who owns them. A company rolls its people up: the contacts who work there, the open deals against it, the open pipeline total, and the next expected close.The timeline
Every contact, company, and deal record keeps a timeline: notes, calls, texts, emails, meetings, and tasks, newest first, filterable by type. Calls arrive with the recording and transcript. Nothing on a record is a claim without the conversation behind it.Gmail and Google Calendar
Connect Google once under Settings → Integrations → CRM and two sources feed the timeline, each of which you can leave unticked:- Gmail — new email conversations with your customers land on their record.
- Google Calendar — upcoming meetings with customers land on their record.
The research agent
Records have an Agent tab where a research agent works a contact or company up for you: it searches public sources (LinkedIn, GitHub, X), shows every step and the source it came from as it runs, and suggests field values — a title, a profile link — that you accept rather than retype. What it found and where it found it stays on the record, so the enrichment is evidence, not a mystery.The research agent is rolling out gradually and may not be enabled on your workspace yet.
Deals
Deals live in two views of the same pipeline: a board (one column per stage, drag to move) and a list (a table you can sort by amount, close date, stage, or last activity, with the stage editable in place). Every deal carries an amount, an owner, a close date, and the customer — the company and the people on it, each with a role.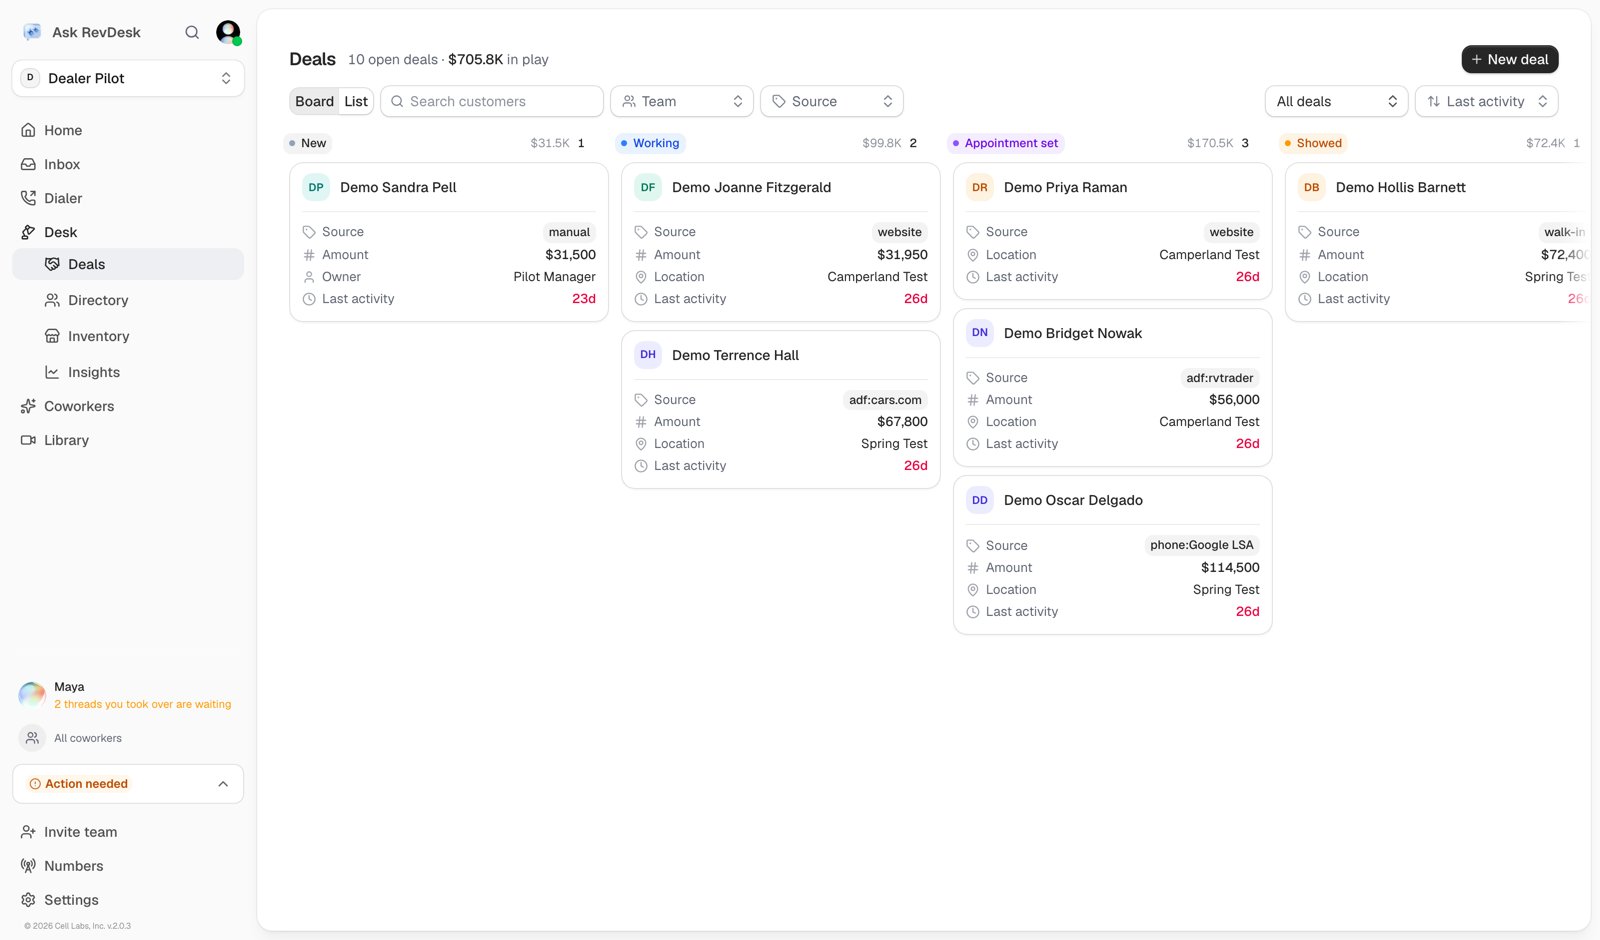
The deal board — one column per stage, with each column's count and value.
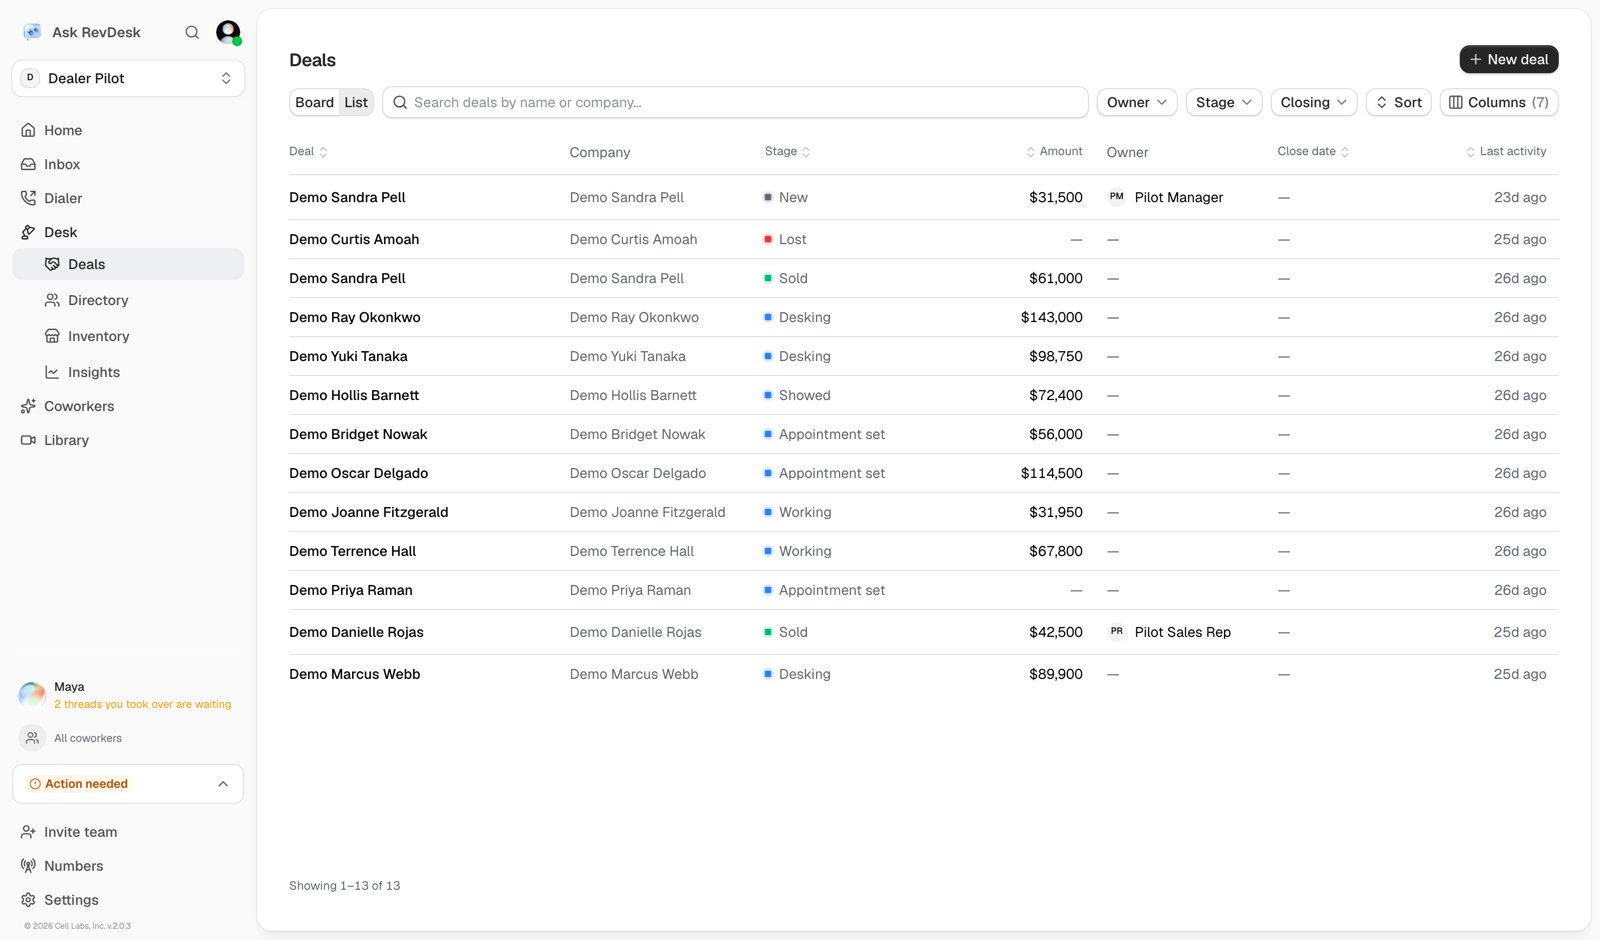
The same pipeline as a list — sortable, filterable, stage editable in place.
The board
One column per stage, left to right, ending in the outcome.
Filter by location, department, source, and owner, and sort by last activity, stalest first, or amount. Filters live in the URL, so a filtered board is a link you can send to someone.
Every pipeline also carries a Disqualified stage for leads that were never a real deal. It is kept out of pipeline value, so a pile of bad leads cannot inflate the month.
Stage names follow your industry
The stages themselves are fixed, since automations and reporting key off them. What changes is the words on the board. Pick the template that matches how your team talks:
A template can also hide a stage its vertical does not use: the Generic CRM template shows Unqualified on the board and skips the desking column, while the industry templates keep Disqualified off the board and out of the way.
Changing the template relabels the board. It never moves a deal.
Desking a deal
Open a deal and it gets a worksheet: the deal’s numbers, created the first time you pencil something. Each deal also carries a short deal number you can say out loud, so “pull up 2208” works. On the worksheet you set the selling price, cash down, trade-ins, fees, and rebates. Then you build scenarios, one per payment option you want to show:
Name them the way you would say them, for example “72 @ 6.99”. A worksheet can hold as many scenarios as you want to compare, and exactly one can be accepted.
Trade-ins
A deal can carry more than one trade, because customers do. Each trade records the allowance (what the customer sees) alongside the actual cash value and the payoff. The gap between allowance and ACV is trade gross, and it stays on the manager’s side of the screen.Working backwards from a payment
Customers usually arrive with a payment in mind rather than a price. The solver takes the payment they want and tells you what it would take to get there, by moving one of three levers:Cash down
Hold the price and term. What does the customer need to put down?
Term
Hold the price and down payment. How many months gets there?
Selling price
Hold the term and down payment. What price gets there?
Tax and fees are per store
Tax rate, tax method, and the fee schedule belong to the rooftop, not the workspace, because a group with stores in two states does not have one answer. Retail and lease are taxed by different methods, and both are set per store. Fees are a schedule you maintain rather than free text: each fee carries its own label, default amount, whether it is taxable, whether it capitalises into a lease, and whether it counts toward front gross. A doc fee usually does; title and registration usually do not. Editing the schedule tomorrow does not reprice a quote you saved today.The numbers do not drift
Everything is computed in exact integer cents. There is no floating-point rounding, because a payment on a signed document should be the payment you quoted. Pencilling a deal also snapshots the unit, so an overnight inventory reprice never silently changes a customer’s numbers.Sending the customer their numbers
When the options are ready, pick the ones the customer should see and send them. They get a text with a link. Sending locks the scenarios you sent, so the numbers the customer is holding stop moving while you keep working the deal. The link is good for 14 days. You can revoke it from the deal at any point, and revoking kills the link immediately rather than at the next expiry. You can see whether it has been opened, and how many times.Front gross, actual cash value, and unit cost are never included in what the customer receives, and are stripped server-side rather than hidden in the browser.
Reports
The monthly view breaks the funnel and win rate down by source, location, and team, with deal counts and pipeline value. Because every deal keeps its source from intake, the totals reconcile against where the leads actually came from.Revenue on Home
The Home dashboard opens on the pipeline itself: open pipeline by stage, closed-won against new pipeline by month, the largest open deals with their share of the pipeline, and the tasks that are overdue. Flip the scope between just my deals and the whole workspace. It uses your stage template’s labels, so the chart reads the way your board does.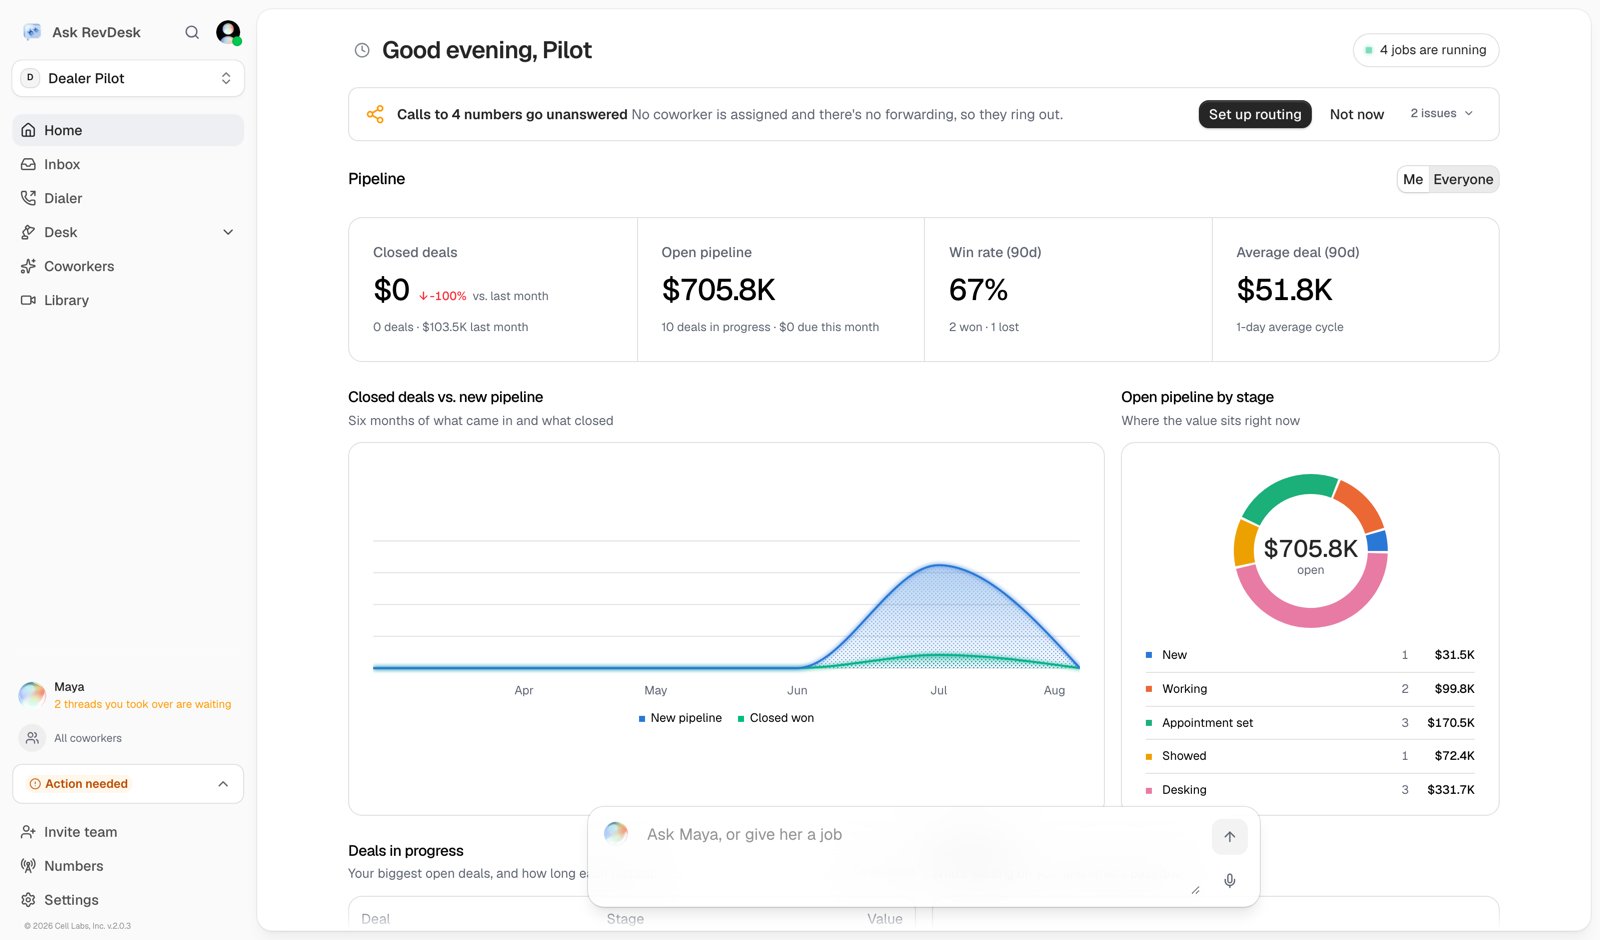
Home opens on the pipeline: totals, trend, and where the value sits by stage.
Inventory
Live unit stock, so a deal is written against a real unit.
Coworkers
Who works the leads that land on the board.